
FAQs
Common questions about performance, signals and risk management.
Frequently Asked Questions
These answers are designed to help you use Stocksaurus with a disciplined process, realistic expectations, and practical risk controls.
How good is this, really?
We characterize backtesting statistical performance in terms of the fraction of winning trades divided by total trades (% Winning Trades) and the fraction of gross dollar gains divided by gross dollar losses (Profit Factor).
Imagine tossing a coin where the probability of heads is equal to the % of Winning Trades and the cumulative winnings on heads divided by cumulative losses on tails is the Profit Factor. The following performance factors are computed based on a 12 month trading period using each symbol in the S&P500, using the position size and, unless noted below, the portfolio management strategy described in Help.
You can view the raw backtesting data for the performance metrics by selecting the period ending date.
Period Ending Profit Factor Winning Trades Aug 12, 2016 5.7 75% Oct 14, 2017 5.9 69% Backtesting Notes:
- Sufficient capital is available for holding concurrent trading positions.
- Stocks are bought and sold at the next day opening price upon a buy or sell signal. No Buy-Stop Limits or stop losses are used.
- A zero net gain is counted as a win, although this is rare.
- The impact of any commission fees has a small negative impact on the profit factor.
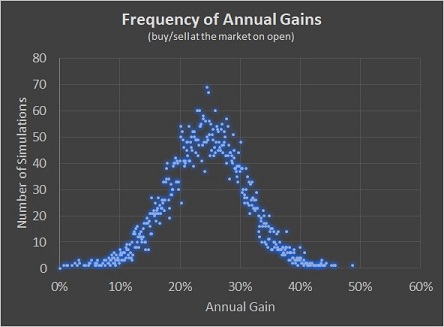
- As in many real-world forecasting scenarios, future stock prices are not known, yet traders value predictable performance in their trading accounts. If we assume the above 12 month performance metrics hold in the future, we can use a Monte Carlo trading simulation to estimate the expected range of future portfolio gains. If we blindly buy and sell upon a signal at the next open with no Buy-Stops or limits, we would expect, on average, an annual gain of 25%.
 CFTC RULE 4.41 - These results are based on simulated or hypothetical performance results that have certain inherent limitations. Unlike the results shown in an actual performance record, these results do not represent actual trading. Because these trades have not actually been executed, these results may have under- or over-compensated for the impact of certain market factors, such as lack of liquidity. Simulated or hypothetical trading programs are also designed with the benefit of hindsight. No representation is being made that any account will or is likely to achieve profits or losses similar to those shown.
When do I sell?
Swing trades are designed to last typically from 2 to 20 trading days. Unlike Buy and Hold strategies, you only keep your money working when there is price movement. Assume that some of your capital will not always be in play.
Therefore, we strive for daily gains in excess of 0.5%, as a gain of 0.5% per day will double your portfolio's value in one year. Sell all or part of your position once you make 3% or more. If the price is still trending after 3%, tighten your sell stop-loss order. Always keep a sell-stop order to protect your initial capital.
Remember that market conditions such as opening price gaps and flash crash events can prevent a sell-stop or stop-limit order from executing. However, the fixed price of sell-stop orders may reduce the risk of selling your stock in the trough of a sudden market dip or flash crash.
What if the buy order is not executed on the day of the order?
The trade signal will usually disappear within one trading day. If the signal does disappear, the thesis of imminent price movement has weakened. Any opened buy orders should be carefully monitored, as new momentum may be delayed several days. Cancel the order if it remains unfilled after 5 days or more.
What should I do with a sell signal?
To keep things simple, Stocksaurus is focused on Long or Buy trade signals. A Sell Stop price on a Sell signal is computed when the data shows a pattern that historically leads to a downward trend.
Use this price in a Stop-Limit order to protect your positions if you are long (holding) the stock. You may use the same price as a Sell Short price if you are inclined to short stocks. The trade signal will usually disappear within one trading day. If the signal does disappear, the thesis of imminent price movement has weakened.
Any opened sell stop orders may remain to protect gains. If the stock price allows, you should continue to move the sell stop price higher or use a trailing stop loss order to protect your position.
Why do some signals seem contrary to what the chart shows?
Stocksaurus may find that an artificial intelligence-based strategy produces the best results on backtesting, even when compared with technically based signals. You may even see a buy signal in a strong downtrend.
In that case, the signal is based on a learned association between a near-term price reversal and a complex data pattern that may not be readily apparent from standard charts or conventional technical metrics.
Why can’t I add my own stocks?
Stocksaurus relies on stocks in the S&P500 with a price history of 18 months or more. The S&P500 naturally evolves, removing underperformers and adding rising stars.
This helps ensure that fundamentals and trading volumes are adequate to minimize the risk of significant price gaps at market open. That risk is often greater in low-volume stocks or in highly inefficient pricing patterns that occur more frequently with smaller companies.
How many Buy signals are listed if I subscribe?
The number of Buy signals in the Subscription tier varies from day to day, but typically ranges from 3 to 12. Since not all symbols listed move in your favor, the additional signals in the Subscriber tier offer more opportunities for profitable trades.
I often see a Buy signal price go down instead of up. Why?
Briefly: market noise can override even high-probability outcomes.
Stocksaurus identifies statistically favorable trading signals by detecting complex data patterns that are often not obvious from standard charts or traditional technical indicators. These signals are based on learned associations between specific market conditions and the increased likelihood of a near-term price reversal.
However, no signal is guaranteed. Short-term volatility and broader market forces can temporarily move a stock in the opposite direction. Importantly, disciplined order execution helps manage this risk. When using a properly placed Buy-Stop-Limit order, you only enter the trade if price confirms movement in your favor. After entry, implementing a protective Stop-Limit order can help manage downside exposure.
Because not every symbol will trigger or move favorably after a trigger, diversification and consistent process execution are key. The Subscriber tier provides additional signals, increasing the number of potential opportunities and helping smooth results over time.
Why is the service cost so low?
Stocksaurus is built on scalable cloud infrastructure and integrates trusted third-party charting tools. Through efficient automation and disciplined system design, we maintain high computational performance and reliability while keeping overhead low.
That allows us to pass those savings directly to subscribers. With dozens of trading opportunities each month, the service is priced so that a single winning trade can often cover the monthly subscription cost.
What if I lose access to the Subscriber User Watchlist?
Re-register using the same email address you originally used to register and subscribe.
What is going on behind the scenes to create these watchlists?
Stocksaurus uses signal processing and machine learning, along with technical trading know-how, to uncover signals for directional trends over a 2–10 day timeframe. Here is our back-end at work: Click here.
Key Takeaway
Stocksaurus is not about predicting every move. It is about finding statistically favorable setups, managing entries carefully, and controlling risk with discipline.
Execution Matters
A good signal still needs proper order placement. Buy-Stop-Limit and Stop-Limit orders help confirm momentum and manage downside exposure more effectively than undisciplined entries.
Diversification Helps
Not every signal will trigger, and not every trigger will work. A broader set of opportunities and disciplined portfolio allocation can make outcomes smoother over time.
The content provided on this website is for informational and educational purposes only and is not intended as financial advice. We recommend consulting with a qualified financial advisor to tailor advice specific to your financial situation.